← Blog from Guindo Design, Strategic Digital Product Design
A brief history of visual programming
Visual programming has come a long way from early flowcharts to the orchestration of intelligent agents. Throughout history, engineers and designers have looked for ways of make the logic of the processes visible, The first was to optimise human tasks, then to plan algorithms, and later to automate data flows and complex systems. Today, these tools allow people with no programming knowledge to understand, manipulate and automate processes, and interact with artificial intelligence agents. This article traces that evolution, showing how the visualisation of logic has transformed the way we think about and build systems.
The origins of flowcharts
Flowcharts emerged in the early 20th century thanks to engineers Frank and Lillian Gilbreth, who used them to document workers' movements and improve efficiency. It was soon realised that these diagrams were also useful for presenting ideas from a business perspective, thanks to their clear and orderly structure.
Early 1930s, Allan H. Mogensen taught business professionals how to represent processes with flowcharts, and in 1947 the ASME standardised its symbols, based on the work of the Gilbreths. In the same year, Herman Goldstine y John von Neumann applied diagrams to the programming of the first computers, turning them into a tool for planning algorithms. For decades they were the dominant visual language for explaining programs, until they lost prominence in the 1970s with the advent of high-level languages. Even so, their legacy persists in modern notations such as UML and in the way we keep trying to see how a machine thinks.
Programming logics and business processes
With LabVIEW, programming took a visual turn. Created by National Instruments in 1986, it allowed programs to be built by linking functional blocks using lines representing the data flow. You didn't have to write code, you had to draw the logic.. This made it possible to see how the information moved and responded in real time, turning the algorithm into something tangible and manipulable, and making programming more intuitive for engineers used to working with diagrams.

In the 2000s, the visual approach came into the business environment with BPMN (Business Process Model and Notation), a standard notation for describing how processes work: what tasks are done, by whom and in what order. BPMN was not a programme, but a visual business language that helped to align managers, analysts and developers. Its formal structure (events, decisions and messages) could be interpreted in management systems (BPM), serving as a bridge to automation. Although it was born outside the software world, its way of thinking about flows and dependencies influenced the design of integration environments closer to development, connecting the business diagram with the programmable flow.
Pipelines to connect things on the internet
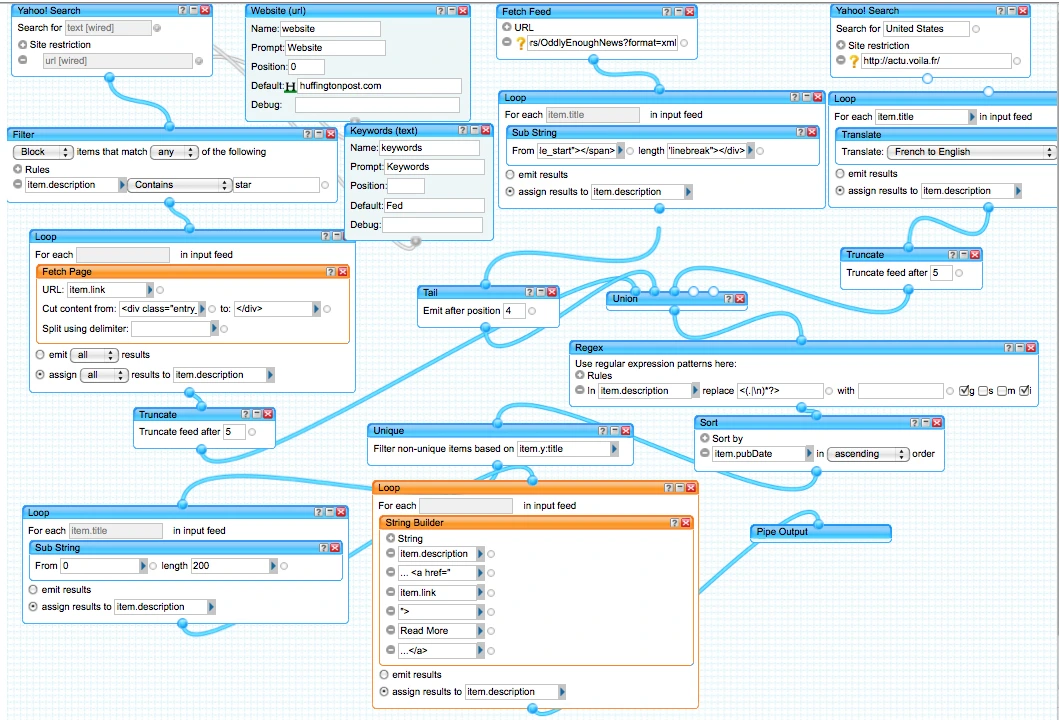
In 2007, Yahoo! Pipes marked a before and after. It allowed any user to mix complex data flows without writing code, connecting RSS feeds, APIs and filters through graphical blocks. Its interface made the flow of information visible and allowed for immediate experimentation, refinement and understanding of logic.
Daniel Raffel, The project's product manager and electronic musician already had experience with visual programming environments for sound, such as Kyma or Max/MSP/Jitter, where users connect audio synthesis and processing modules via virtual “wires”, emulating the experience of analogue synthesisers. These environments encourage a way of thinking based on information flow and dependencies between functional blocks, the same mindset that later made the Yahoo! Pipes interface intuitive. Although the transition from music to data is not literal, the underlying philosophy - experimenting, connecting blocks and observing the flow in real time - is identical.
For its part, Sal Soghoian, also with a musical background, offered another perspective related to task automation. He recalled an unpublished version of Automator which allowed modular blocks to be connected by detachable cables, a clear predecessor of Pipes' visual approach.
Although it disappeared in 2015, its legacy lives on in modern visual integration platforms. If you want to delve into more detail about the history of Yahoo! Pipes, this article by Glen Fleishman in Retool is a jewel.
From the 2010s onwards, tools such as Node-RED, Zapier e IFTTT took visual programming a step further, focusing on automation and logic reuse. Node-RED allowed nodes representing sensors, APIs or data transformations to be linked into flows that responded to real-time events. Zapier and IFTTT applied the same philosophy to business and everyday tasks, triggering processes automatically based on events. The success of these tools relied on the clarity of the user experience, which showed how the data flowed and allowed variations to be tested without understanding complex code..
Platforms such as n8n y Make continued to extend this paradigm, bringing visual programming closer to non-technical users and offering modular flows to integrate applications and services with conditional logic. With tools such as Agent Builder In OpenAI, the approach takes another qualitative leap: it is no longer just about connecting APIs, but about orchestrating AI agents capable of automatic reasoning.
Although the elements we manipulate today are more abstract, the objective remains the same as in the early flowcharts: making the logics of decision-making visible of people or machines, enable users to manipulate complex relationships and understand how different elements of the system interact.