← Blog from Guindo Design, Strategic Digital Product Design
100 years of flowcharts
As interaction designers, a large part of our job is to graphically document conceptual aspects such as processes and functions, descriptions of models that can affect either the software or service we are designing. One of the most commonly used models, when representing algorithms or processes, are flowcharts: an artefact that visually and sequentially describes the instructions of a process.
Its history dates back to the beginning of the 20th century, roughly between 1908 and 1924, when it Frank y Lillian Gilbreth systematically studied the movements performed by workers with the aim of improving their tasks. They documented this study by films and 3D models of the movements.
To graphically project this systematic research, they created a visual alphabet called “Therbligs” (Gilbreth read backwards), naming each of the actions involved in a task.
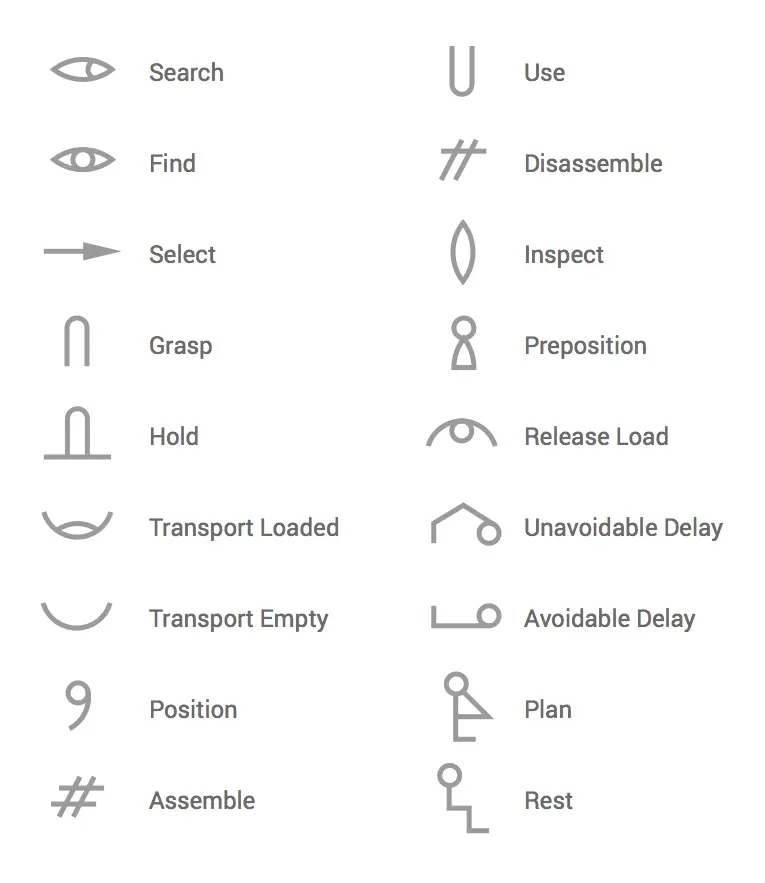
By diagramming therbligs sequentially, they could identify those tasks that were unnecessary or inefficient, eliminating even fractions of a second in wasted time, thus creating the first process charts.
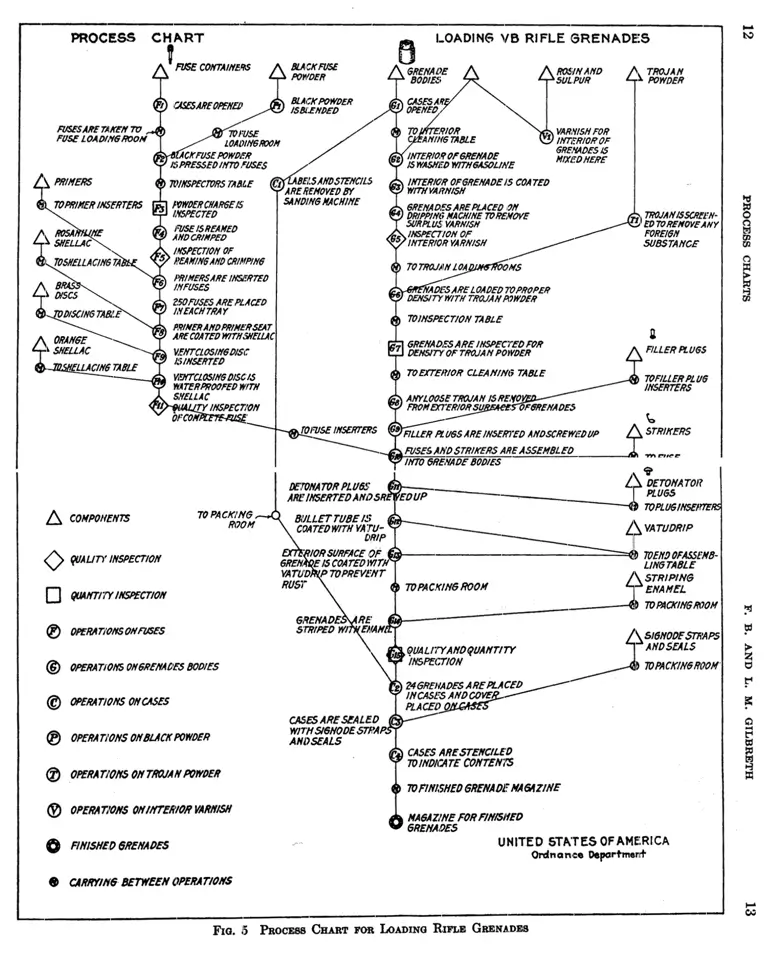
Frank Gilbreth presented in 1921 the first flow chart to the members of the ASME. In his paper «Process Charts - First Steps in Finding the One Best Way«The result of joint research with his wife, already emphasises the synthetic and iterative purpose of the artefact:
The Process Chart is a device for visualising a process as a means of improving it. Every detail of a process is more or less affected by every other detail; therefore the entire process must be presented in such form that it can be visualised all at once before any changes are made in any of its subdivisions. In any subdivision of the process under examination, any changes made without due consideration of all the decisions and all the motions that precede and follow that subdivision will often be found unsuited to the ultimate plan of operation.
The Gilbreth's intention was to represent in a graphical, abstract and synthetic way, the current conditions of a process, with the aim of optimising it to make it more profitable and efficient. By diagramming a process it is easier to detect an error and possible inconsistencies, as there is an overview of the whole system.
They soon came to the conclusion that it was also an effective way to present an idea from a business or service point of view, as it is a very structured visualisation.
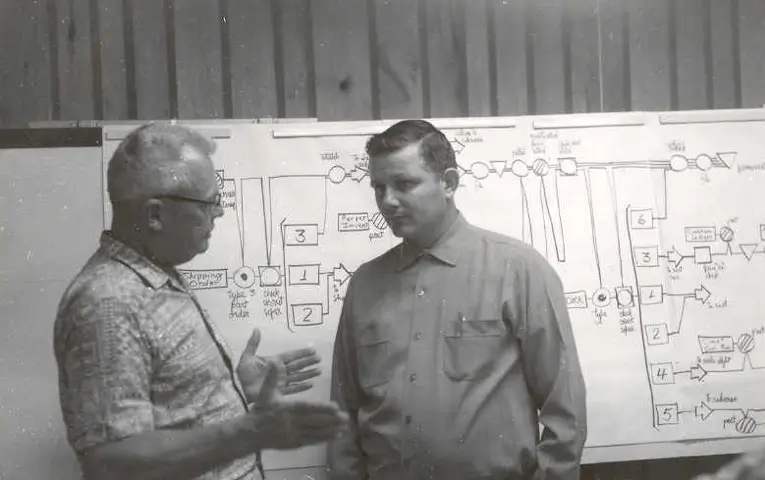
Early 1930s, Allan H. Mogensen, an industrial engineer who had studied the Gilbreth methods, after doing consulting work for companies such as Kodak, joined Lillian Gilbreth and Associates and began training business people in the methods of simplifying work through process modelling.
The use of flow charts was a good tool to mediate between the different departments and actors involved, helping to solve communication problems and ironing out possible discrepancies. It also allowed identify patterns and similarities between processes, This will enable a more efficient use of tasks and facilitate the transfer of skills.
Mogensen trained many people in the “.“Work Simplification Conferences”The six-week intensive programme was held in Lake Placid (New York) and since 1937 has influenced professionals such as Art Spinanger and Ben S. Grahan, which through its programme “Deliberate Methods of Change”Grahan's work helped save billions of dollars for companies such as Procter & Gamble. Grahan also helped to take the original diagram presented in Mogensen's lectures further, expanding it to multiple information flows.
A few years later, in the midst of the fervour of the Scientific Management, In 1947, the ASME adopted a set of 5 symbols, derived from the Gilbreth's original work, as the standard for process diagrams. The same year Herman Goldstine y John von Neumann created the current visual alphabet for flowcharts in computer engineering, which corresponds to the basic functions or instructions of a computer, thus facilitating subsequent translation into a programming language.
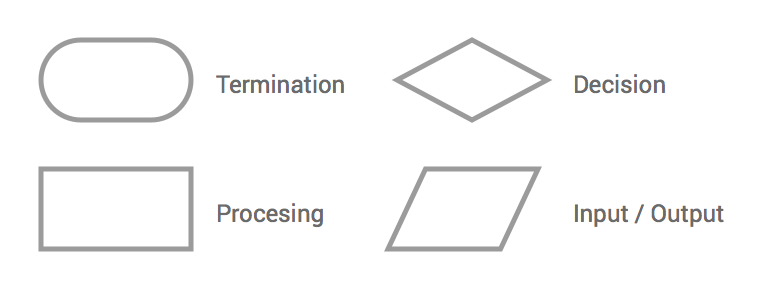
The symbols are as follows:
- Termination (oval rectangle), where the diagram starts or ends.
- Process (rectangle), shows the calculations performed.
- Decision (rhombus), indicates a true or false situation.
- Input / output, indicates read and write functions.
In interaction design, the latter are often used, in a more or less sophisticated version depending on the context, and in a more flexible way by combining them with other graphic elements.
It is surprising that despite being an artefact used in a multitude of innovation disciplines and methodologies, it is a tool with more than 100 years of diagrammed history.
Bibliography:
- Ferguson, D. (2000). Therbligs: The Keys to Simplifying Work
- Gilbreth, L. (1921). Process Charts
- J. Lau & T. Xing (2009). Understanding Flowcharts
- Graham, B. (2001). Allan Mogensen and his Legacy